Stable Isotopes in food web studies
Stable Isotope
Isotope is defined as elements with same atomic number (= same number of protons) and different neutron number. Therefore, isotopes of an elements have different mass. For example, 12C, 13C and 14C are all carbon isotopes and 13C and 14C are heavier isotopes than 12C Stable isotopes are isotopes which is stable without radioactive decay. 14N is a radioactive isotope emitting radioactive radiation, eventually collapsing into 14N while 13C is a stable isotope which remain stable in nature. Usually, heavier stable isotopes exist in very little amount in nature. In a person of 50 kg, 13C weighs only 137g while 12C does 11.4 kg. For nitrogen, 15N weighs only 5.1 g while 14N does 1.3 kg.

Hydrogen: 1H, 2H, 3H (radioactive)
Carbon: 12C, 13C, 14C (radioactive)
Nitrogen: 14N, 15N(radioactive)
Oxygen: 16O, 17O, 18O
Sulfur: 32S, 33S, 34S, 35S (radioactive), 36S
Expression of isotope signature
The way to express very small ratios of heavier stable isotope, which is called 'isotope signature', is to compare the ratios of heavier isotopes to the lightest isotope in samples and the standards in unit of per thousands (‰). For example, the standard material for carbon is PDB (Pee Dee Belemnite) limestone which shows unusually high ratio of 13C to 12C. δ(delta) is the symbol of the isotope signature.
Carbon stable isotope signature can be calculated as follows:

Most samples would have lower ratios of heavy stable isotope than the standard material (PDB limestone), giving negative δ13C signature values. The standard material for nitrogen is aerial nitrogen which have very low ratio of heavy nitrogen isotope (15N). Therefore, most samples would have positive δ15N signature values.
Patterns of stable isotope signature values in nature
Organisms in nature have specific stable isotope signature which can vary due to several factors. Plants show stable isotope signature values due to photosynthesis pathways and nutrient supply while animals do due to their diet and trophic positions. For carbon stable isotope signature, C4 plants such as Poaceae and Cyperaceae show -12 ~ -16 ‰, which is relatively heavier values than C3 plants (-24 ~ -28). Top predators such as tuna fish in the sea exhibit very high nitrogen stable isotope values while 13C signatures are around -20.
Use of stable isotope in food web studies
Carbon and nitrogen stable isotope is very popular in trophic relation studies. Since they are abundant, it is easy to detect isotope signature. In addition, carbon and nitrogen show a predictable changes through trophic relations. Nitrogen signature values increase a certain amount (for example, 3.4‰) per trophic levels while carbon sigantures show a relatively small increases. If we show carbon stable isotope signature on X axis and nitrogen signature on Y axis, which is called C-N diagram, we can describe food web structure in a quantitative way. Y axis can be interpreted as trophic position while X axis indicate different diet sources. If A feeds on B which feeds on C, the signature values of A, B, and C will be plotted with similar x coordinates and y coordinates with A > B > C (the differences would be average 3.4‰ in theory). if a predator feed on two different diets, its carbon signature would be close to signature of the more fed diet.
An example of trophic position estimation based on nitrogen signature
Traditionally, producers, primary consumers and secondary consumers are called
'trophic levels' and regarded as a fixed trophic position (1, 2, 3). Recent advances in stable isotope studies made a new concept called 'trophic position' based on nitrogen isotope signature values. Trophic position can be calculated using a certain fractionation factor such as 3.4‰ per trophic level as follows:
Trophic position = (δ15N consumer - δ15N primary producer) /3.4 + 1
Fractionation factors can vary depending on systems. Since δ15N signature of primary producers can vary due to nutrient characteristics (sewage input may increase δ15N signature of phytoplankton), primary consumer such as filter feeding bivalve can be used as a basal organisms in calculating trophic position. In this case, trophic position can be calculated as follows:
Trophic position = (δ15N consumer - δ15N primary consumer) /3.4 + 2
Trophic position can be real numbers with decimal point such as 3.2 rather than integer (1,2,3,..).
A recent article shows that trophic positions of a fish species, Japanese aucha perch, Coreoperca kawamebari, were highly correlated with body length.

Fig. 2. (a) Relationships between body size of Coreoperca kawamebari and their trophic position and (b) average trophic positions of body size group of Coreoperca kawamebari from Journal of Ecology and Environment 44:2.
An example of C-N diagram for food web structure
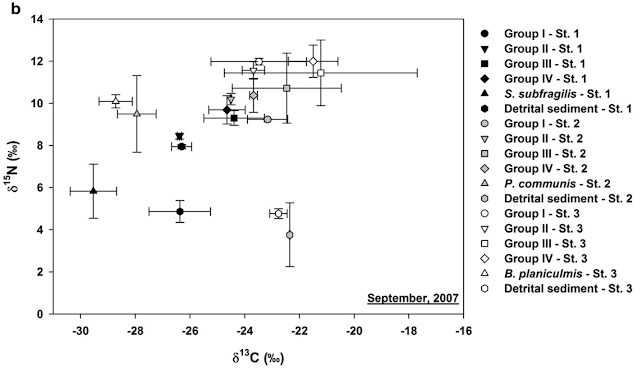
Fig. 3. δ13C and δ15N diagram of the Han River estuary wetland in the active season of foraging (September 2007) from Journal of Ecology and Environment 43:6.
I hope that you would understand what δ13C and δ15N means and how you can interpret C-N diagram as food web structure. It is quite easy to prepare samples for stable isotope analysis, which is basically drying samples and encapsulate samples in tin capsules or circles in 96-well plates. However, there are some caveat in the interpretation of stable isotopic C-N diagram. Aligning on x axis does not guarantee that the two organisms have trophic relations. Stable isotope values only suggest feeding relationships. Other biological observations and evidence such as fatty acid compositions would be in order to make more conclusive interpretation. Please be careful with your interpretation with stable isotope data!
by Sangkyu Park (Editor-in-Chief of Journal of Ecology and Environment)
References
Choi J-Y, Kim S-K, Kim J-C, Yoon J-D. 2020. Trophic position and diet shift based on the body size of Coreoperca kawamebari (Temminck & Schlegel, 1843). Journal of Ecology and Environment 44:2
Fry B. 2006. Stable Isotope Ecology. Springer
Post DM. 2002. Using stable isotopes to estimate trophic position: models, methods, and assumptions. Ecology 83: 703-718.
Sánchez-Carrillo S, Álvarez-Cobelas M. 2018. Stable isotopes as tracers in aquatic ecosystems. Environmental Reviews 26:69-81.
Wada E, Hattori A.1990. Nitrogen in the Sea; Forms, Abundance and Rate Processes. CRC Press.
Yang D, Han D, Park S. 2019. Intraspecific diet shifts of the sesarmid crab, Sesarma dehaani, in three wetlands in the Han River estuary, South Korea. Journal of Ecology and Environment 43: 6.
Comments
Post a Comment